Column Charts
Advertisement

FusionCharts for Dreamweaver - Designer Edition
FusionCharts for Dreamweaver (Designer Edition) is a DW Charting Extension that can be used to render interactive & animated charts for web applications and presentations. FusionChartsDW is a cross-browser and cross-platform solution that can be used to
Advertisement
VisiTrend v.1.1.0.4
VisiTrend makes project performance monitoring and reporting a point and click operation. Export charts & reports in multiple formats to share with team members and stakeholders. Presentation quality charts enhance any status report.
StatTrends v.1.1
StatTrends (formerly "Graph Maker") is a free application for creating interactive charts and graphs.
SpreadsheetConverter to HTML/JavaScript v.3. 7. 2003
At last you can create online calculators without the help of a programmer. All you need is Microsoft Excel. Calculate on the WEB. Convert MS Excel spreadsheet into good-looking calculating web page. No plugins. Using this unique software, everyone
SpreadsheetConverter for HTML v.5.2.29
SpreadsheetConverter for HTML (formerly ExcelEverywhere) enables you to easily convert your Excel spreadsheets to interactive HTML pages, that allow the visitor to perform instant calculation based on the dat you provide.

2imaze Accounts v.1.1.0.0
Maintain your SAP CRM customers and contact persons. The SAP CRM ABAP code can be downloaded from http://www.2imaze.com -> our solution/apps -> 2imaze business apps Download our demo app for free: 2imaze (available on Windows Phone Marketplace).
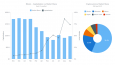
AnyChart JS Charts and Dashboards v.8.7.0
AnyChart is a flexible, cross-platform/browser, dependency-free JS chart library for adding interactive bar, area, pie, column, spline, scatter, line, gauge, treemap, funnel, sparkline, Mekko, Venn, other HTML5 charts/dashboards to any website/app.
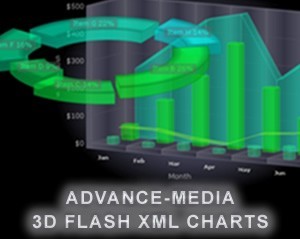
3D charts v.3.1
Create eye catching visual enticing animated and interactive 3D+2D FLASH (swf as1-3) chart presentations with this system, one of the most comprehensive 3D charting tools around.
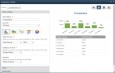
SharePoint Business Charts v.1.0.806.3
SharePoint Business Charts can quickly and Easily Create Charts,Multiple Chart Types Supported,Supports Aggregate Functions to Analyze Data,Supports Multiple Data Sources,Supports Grouping and Filtering,Customizable Appearance.
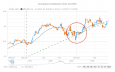
AnyStock Stock and Financial JS Charts v.8.7.0
AnyStock Stock and Financial JS Charts is a flexible JavaScript charting library to visualizing large data sets in interactive HTML5 charts. Designed to display date/time information it offers various chart types, drawing tools, technical indicators.
AnyGantt JS Gantt Charts v.8.7.0
AnyGantt is a flexible, cross-platform and cross-browser JavaScript charting library that allows you to easily build smart HTML5 Gantt Charts and utilize the power of animation and ultimate interactivity to facilitate project and resource management.